Foods High in Uric Acid Chart: Purine Levels by Food (Real mg/100g Values)
Search “foods high in uric acid chart” and you get dozens of lists that all look alike — and nearly all of them disagree with each other. One says lentils are fine; the next calls them dangerous. One lists salmon as safe; another red-lists it. None of them tell you where their numbers came from.
This chart is different. Every value below comes from a single verified purine database — 38,078 foods with laboratory-measured purine values, reported in milligrams per 100 grams. No guesses, no borrowed numbers, no “about” figures. Where our database has no measured value for a food, we say so instead of inventing one.
The result is a chart you can actually use: foods sorted into practical bands, each with its measured number, so you can see at a glance where any food sits — and why.
How to read a purine chart
Purine content is measured in milligrams per 100 grams of food. When you eat purines, your body breaks them down into uric acid, so foods with more purines have a bigger effect on your uric acid load. The bands below are a practical grouping for everyday use — they are not medical cutoffs:
- Red band — very high (above ~200 mg/100g): the foods to keep smallest and rarest, especially during a flare.
- Middle band — moderate (~50–200 mg/100g): normal portions a few times a week fit fine for most people with gout.
- Green band — low (below ~50 mg/100g): eat freely; these foods barely move your uric acid.
One important note before the numbers: cooking changes purine density. A dried anchovy packs 1,109 mg of purines into 100 g largely because the water is gone — the same fish rehydrated or canned measures much lower. Compare like with like: raw to raw, cooked to cooked.
The red band: very high purine foods
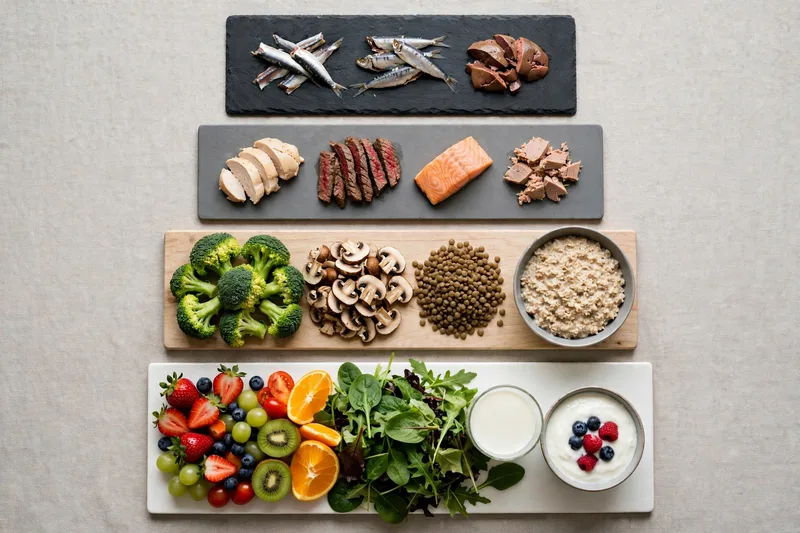
These are the heavyweights. Small oily fish and organ meats dominate this band — and the gap between them and everything else is enormous.
| Food | Purines (mg/100g) |
|---|---|
| Anchovy, dried | 1,109 |
| Anchovy, raw | 411 |
| Sardine, canned | 399 |
| Herring, canned | 378 |
| Anchovy, canned | 321 |
| Pork liver, raw | 289 |
| Salmon, Atlantic farmed, raw | 249.9 |
| Mackerel, canned | 246 |
| Beef kidney, cooked | 230.8 |
| Lentils, dried, raw | 222 |
| Beef kidney, raw | 213 |
Two things stand out. First, dried anchovy is in a league of its own — more than double the next food on the list. Second, dried lentils look alarming at 222 mg, but that is a raw, dried value; cooking more than triples their weight in water, which dilutes the per-100-g figure, and plant purines behave differently in the body anyway (more on that below). Our database does not have a measured value for cooked lentils yet, so we state the gap honestly rather than filling it with someone else’s number.
For a deeper tour of this band with flare-day rules, see our red-zone list of foods to avoid with gout, which builds out the full reasoning.
The middle band: moderate purine foods
This is where most everyday protein lives. Nothing here demands elimination — portion size and frequency do the work.
| Food | Purines (mg/100g) |
|---|---|
| Beef liver, raw | 197 |
| Tilapia, farmed, raw | 185.8 |
| Shrimp, farmed, raw | 182.4 |
| Chicken breast, roasted | 178.5 |
| Beef brain, raw | 162 |
| Beef, ground, 73% lean, raw | 133.3 |
| Chicken breast, raw | 141.3 |
| Veal cutlet, cooked | 142.7 |
| Tuna, canned | 142 |
| Squid, raw | 135 |
| Beef sirloin, raw | 124.8 |
| Scallops, raw | 76.5 |
| Miso | 56.13 |
Notice how tight this band is: roasted chicken breast (178.5 mg) and lean ground beef (133.3 mg) sit closer together than most charts suggest. The popular “chicken is safe, beef is not” framing doesn’t survive real measurements — both are moderate, and both work in sensible portions. For meal-by-meal guidance, our gout diet plan turns these numbers into plates.
The green band: low purine foods
The safest class in the database. Dairy, most fruit, vegetables, grains, and eggs sit far below the bands above — some by a factor of a hundred.
| Food | Purines (mg/100g) |
|---|---|
| Broccoli, raw | 70 |
| Peanuts, raw | 49.1 |
| Mushrooms, raw (not further specified) | 46.9 |
| Brussels sprouts, raw | 38.8 |
| Asparagus, raw | 32.85 |
| Almonds | 31.4 |
| Tofu (kinu) | 20 |
| Sweet potato, raw | 17 |
| Bread, baguette | 15.7 |
| Cucumber, raw | 9.4 |
| Potato, raw | 6.5 |
| Rice, white, cooked | 5.9 |
| Cherry tomatoes, raw | 3.1 |
| Bananas, raw | 3 |
| Strawberries, raw | 2.2 |
| Onions, raw | 2.2 |
| Carrots, raw | 2.1 |
| Green tea (beverage) | 1.67 |
| Milk, 2% fat | 0.6 |
| Egg white, boiled | 0.73 |
| Honey | 0.8 |
Dairy is the standout: milk at 0.6 mg/100g and plain yogurt at 7 mg/100g make it the lowest-purine protein class you can eat — and research links higher dairy intake to lower gout risk. If you want the full green-zone tour, our companion guide to the best foods for gout builds a whole plate from this band.
What the numbers don’t tell you: alcohol and fructose
A purine chart ranks food purines — but uric acid rises through two more routes that no purine chart captures. Alcohol slows the kidneys’ excretion of uric acid and speeds its production. Measured beer purines look modest (regular beer 8.48 mg/100mL, dark beer 13.51 mg/100mL), yet beer is consistently one of the worst drinks for gout because of the alcohol effect, not the purine count. Whiskey measures just 0.21 mg/100mL of purines and is still bad for gout for the same reason.
Fructose works through its own pathway: your body produces uric acid as it metabolizes fructose. A long-running study of nearly 79,000 women found that two or more sugar-sweetened sodas a day more than doubled gout risk (relative risk 2.39), while diet soft drinks showed no association — the sugar, not the fizz, was the problem. So treat beer, spirits, and sugary drinks as honorary red-band items even where their purine numbers look small. Our database does not have a measured purine value for sugar-sweetened soda; the risk evidence comes from the fructose research, not a purine table.
Plant purines play by different rules
Old charts lumped spinach, lentils, and mushrooms in with liver and sardines because their purine numbers looked similar. The research says otherwise: in the landmark 12-year study of 47,150 men, high meat intake raised gout risk by 41% and high seafood intake by 51%, but purine-rich vegetables showed no association with gout at all. So read the chart with this rule of thumb: animal-source purines count most, plant-source purines count far less, and no food in the green band deserves fear.
How to use this chart every day
Don’t memorize the table — use the bands as a reflex:
- Red band: smallest portions, fewest times per month. Never during a flare.
- Middle band: normal servings, most days of the week, paired with green-band foods.
- Green band: the base of every meal. Dairy, eggs, fruit, vegetables, grains, and plenty of water.
Pair the chart with the full 38,078-food purine database whenever you meet a food that isn’t on it — look up the exact measured value instead of guessing. If a number surprises you, check our gout FAQ; and if you’re weighing whether your levels are high at all, read what high uric acid really means and the gout symptoms guide. Diet supports treatment — it never replaces a doctor’s plan.
References
- Choi HK et al., “Purine-rich foods, dairy and protein intake, and the risk of gout in men,” N Engl J Med 2004 — 12-year study of 47,150 men: highest meat intake raised gout risk 41%, highest seafood intake 51%, dairy lowered it; purine-rich vegetables showed no association.
- Choi HK et al., “Fructose-rich beverages and risk of gout in women,” JAMA 2010 — 22-year study of 78,906 women: two or more sugar-sweetened sodas daily more than doubled gout risk; diet sodas showed no association.
- FitzGerald JD et al., “2020 American College of Rheumatology Guideline for the Management of Gout,” Arthritis Care Res 2020 — the standard management guideline: medication with a treat-to-target strategy, with diet as supporting care rather than a substitute.
For education only — not medical advice. Discuss diet changes with your doctor.